Your Digital Shelf, Simplified — Insights You Can Act On
We track the metrics that matter most to the digital shopper journey, then tell you what they mean and what to fix first — so you can drive sales growth without getting lost in complex dashboards.

The Impact of Triarch eComm Pulse


What Matters, Delivered
Your Weekly Action Plan for Growth
Gain instant access to clear, prioritized actions every week — no guesswork, no clutter. Triarch Pulse delivers a focused roadmap of exactly what to tackle so your team can spend less time analyzing and more time driving eCommerce growth.

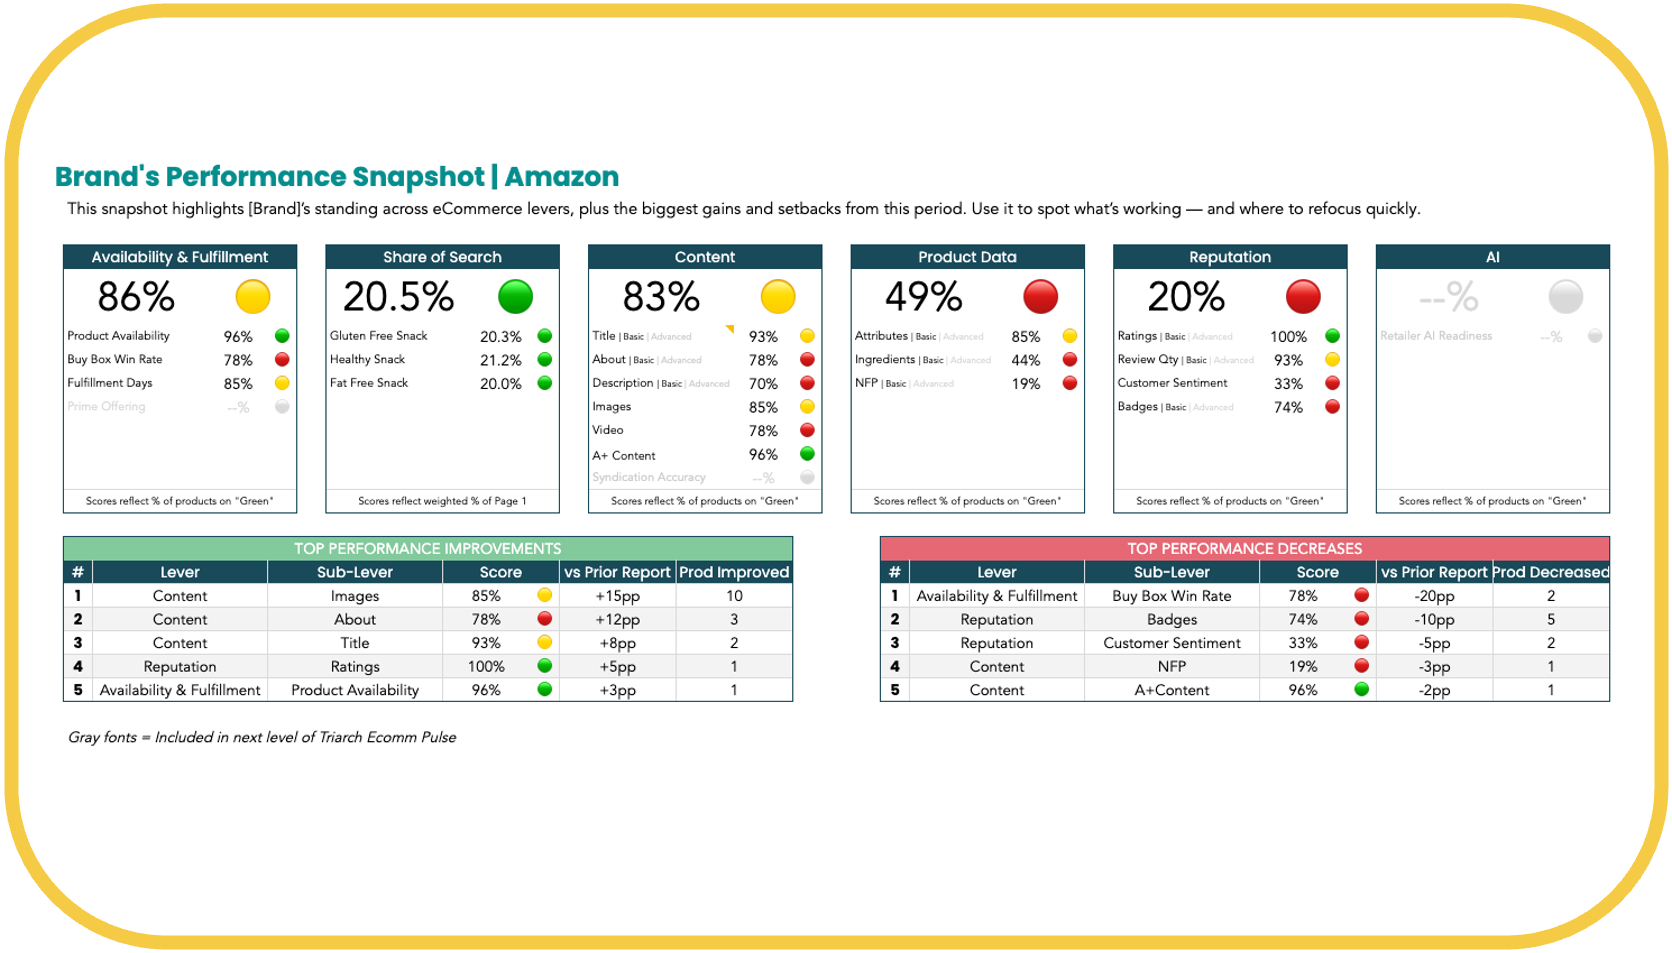
Your Executive Dashboard at a Glance
Stay on top of performance across every eCommerce lever — all in one clear, executive-ready view. Triarch Pulse highlights top trends each week, showing which areas are improving and where attention is needed, so you can make fast, confident decisions.
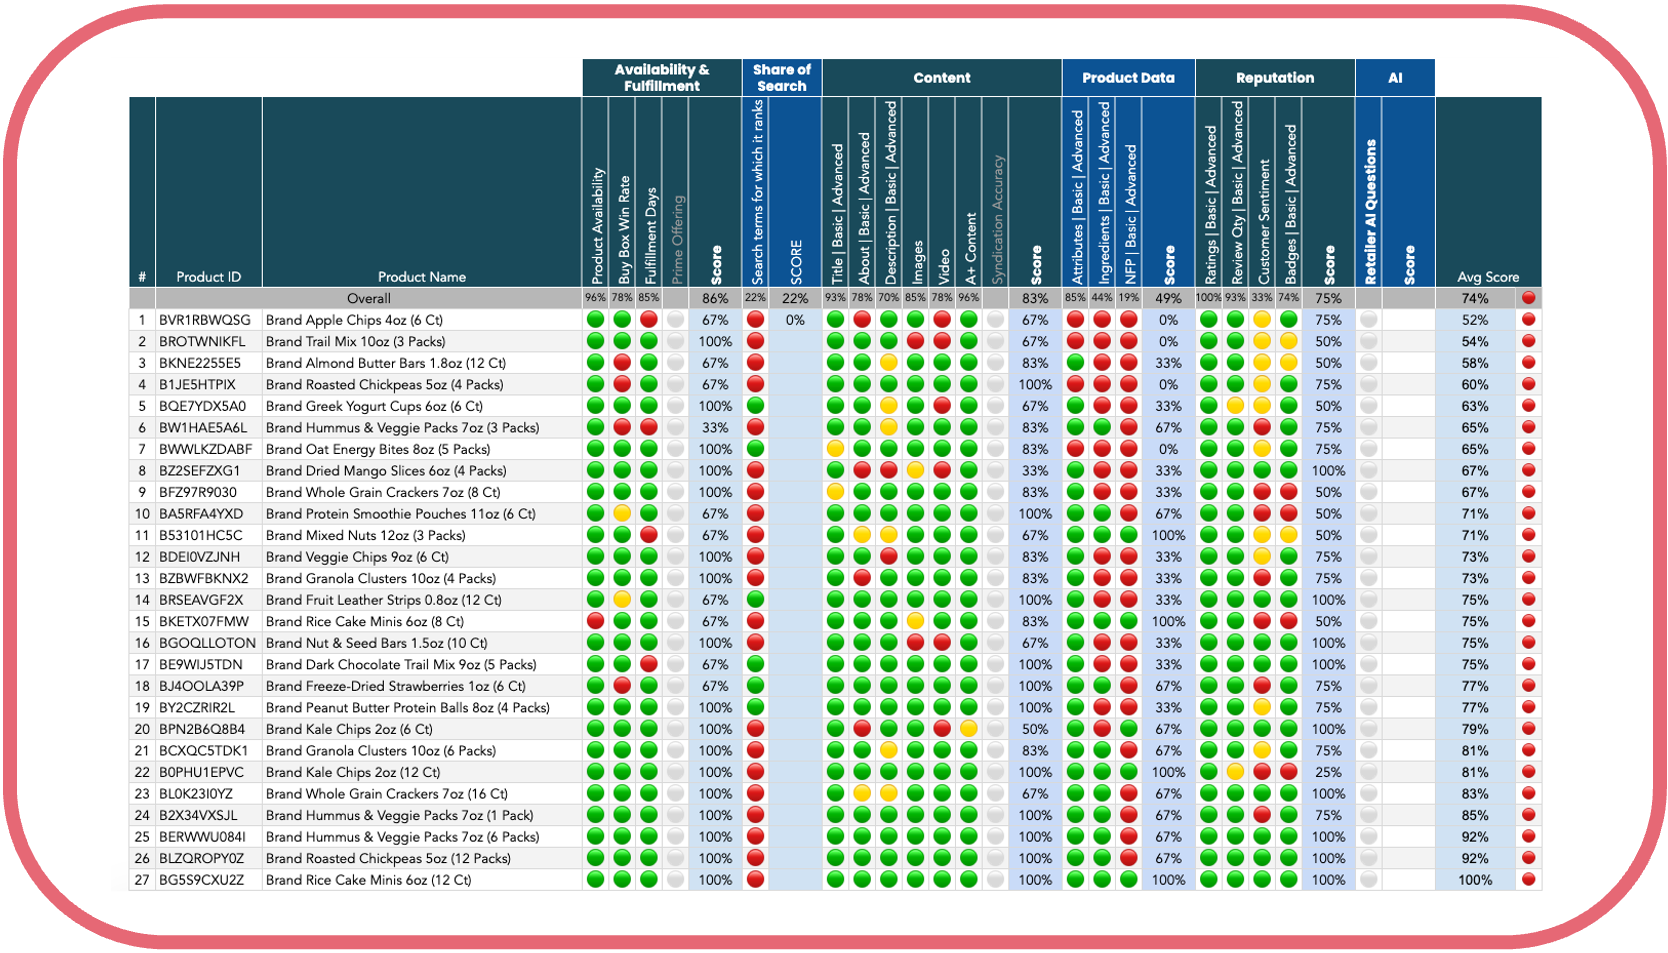
Full Visibility, Product by Product
A simple, powerful way to monitor your portfolio. With red, yellow, and green signals across each product and lever, you can quickly identify risks, catch missed opportunities, and keep your digital shelf in top shape.
The Right pulse for Every Stage
| Basic | Premium | |
|---|---|---|
| WHAT | ||
| Availability & Fulfillment | ||
| Product Availability | 🟢🟢🟢 | 🟢🟢🟢 |
| Buy Box Win Rate | 🟢🟢🟢 | 🟢🟢🟢 |
| Prime offering (for Amazon) | ⚪⚪⚪ | 🟢🟢🟢 |
| Fulfillment Days | 🟢🟢🟢 | 🟢🟢🟢 |
| SoS | ||
| Share of Search |
🟢⚪⚪
3 search terms
|
🟢🟢🟢
10 search terms
|
| Content | ||
| Marketing Copy |
🟢⚪⚪
Basic Benchmark SEO Readiness
|
🟢🟢🟢
Top Products Benchmark SEO Readiness Syndication Accuracy
|
| Carousel | Images | ||
| Image Quality & Coverage |
🟢⚪⚪
Image Quantity
|
🟢🟢🟢
Image Type Coverage Top Products Benchmark Image Quality Syndication Accuracy
|
| Carousel | Video | ||
| Video Content |
🟢⚪⚪
Video Presence
|
🟢🟢🟢
Top Products Benchmark Quality Assessment
|
| A+ Content | ||
| A+ Content |
🟢⚪⚪
A+ Content Presence
|
🟢🟢🟢
Top Products Benchmark A+ Content Quality
|
| Product Data | ||
| Product Details (Attributes) |
🟢⚪⚪
Basic Benchmark
|
🟢🟢🟢
Top Products Benchmark Data Accuracy
|
| Ingredients (if applicable) |
🟢⚪⚪
Presence
|
🟢🟢🟢
Presence Data Accuracy
|
| NFP (if applicable) |
🟢⚪⚪
Presence
|
🟢🟢🟢
Presence Data Accuracy
|
| Reputation | ||
| Average Rating |
🟢🟢⚪
Basic Benchmark
|
🟢🟢🟢
Top Products Benchmark
|
| Review Quantity |
🟢🟢⚪
Basic Benchmark
|
🟢🟢🟢
Top Products Benchmark
|
| Customer Sentiment |
🟢🟢🟢
Per Retailer AI Summary
|
🟢🟢🟢
Per Retailer AI Summary
|
| Retailer badges |
🟢⚪⚪
Presence
|
🟢🟢🟢
Top Products Benchmark
|
| AI | ||
| Retailer AI Readiness | ⚪⚪⚪ |
🟢🟢🟢
Top 5 AI Questions
|
| Pricing | ||
| Pricing Position | ⚪⚪⚪ |
🟢🟢🟢
Top Products Benchmark Price/Unit Benchmark Price/Unit Consistency
|
| Discounts | ⚪⚪⚪ |
🟢🟢🟢
Top Products Benchmark
|
| Competitors | ||
| Competitor Watcher | ⚪⚪⚪ |
🟢🟢🟢
Up to 5 brands
|
| Unauthorized 3Ps Monitoring | ⚪⚪⚪ | 🟢🟢🟢 |
| HOW AND WHEN | ||
| Reporting Cadence |
🟢⚪⚪
Monthly
|
🟢🟢🟢
Weekly
|
| Reporting method | Email + Online Dashboard | |
| Max number of ASINs / retailer |
🟢⚪⚪
20
|
🟢🟢🟢
100
|
| Historic data |
🟢⚪⚪
Up to 6 months MoM Trend Reporting
|
🟢🟢🟢
Up to 24 months MoM Trend Reporting YoY Trend Reporting
|
| OTHER | ||
| Advisory Calls |
🟢🟢⚪
Quarterly
|
🟢🟢🟢
Monthly
|